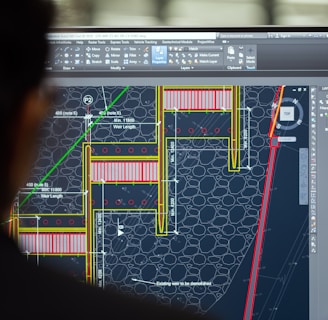
An individual is in front of a computer monitor displaying a detailed architectural or engineering design, possibly a floor plan or structural layout with measurements and annotations. The design is composed of various lines in colors like yellow, red, and green against a dark background, and the interface resembles a CAD software.

Gallery

Showcasing data engineering and BI projects.

The image depicts an architectural or engineering workspace featuring technical drawings with precise measurements and annotations. Several drafting tools, including a pen, pencil, protractor, and triangular scale, are placed on top of the drawings. A rolled-up sheet of paper and a metallic rectangular case are also visible, adding to the professional and organized setting.
Several industrial engines with red components are neatly arranged on wooden pallets inside a workshop with a tractor nearby. The environment features concrete floors, a high ceiling with metal beams, and overhead lighting. Yellow pipes and equipment are visible on the walls, adding to the industrial atmosphere.
A laptop with an open screen displaying dashboard analytics featuring charts, graphs, and numerical data related to sales and subscriptions. The interface is predominantly dark-themed with sections highlighting key performance metrics. The device shown is a MacBook Pro, indicated by the keyboard layout and branding.
A person wearing a white lab coat is seated at a desk, working on a computer. The computer screen displays what appears to be a digital model or design. The workspace includes a shelf with technical equipment and tools scattered on the desk. A window allows natural light to enter the room, illuminating the scene.
A person is viewing a map with red data points on a computer monitor, likely indicating a geographical distribution. The image has a focus on technology and data analysis.

Data Projects

Showcasing expertise in data engineering and BI solutions.

A person with a striped shirt and a cap is standing in front of a computer screen displaying data and analytics. Another laptop is open on a desk below the monitor, and a large metallic tank with a pressure gauge is nearby.
ETL Processes

Streamlined data extraction, transformation, and loading workflows.

A 3D illustration featuring a web browser interface with the word SEO, various charts and graphs, a pie chart, and a rocket launching from the top of the window. The background is dark with scattered white dots, resembling a starry sky.
Data Warehousing

Designed scalable data storage solutions for analytics.

A digital rendering depicting a tall, metallic server rack positioned centrally on a platform. The server appears to have multiple blue-lit slots. Surrounding the rack, there are several stacks of cylindrical objects resembling databases or storage units, all set against a dark background.
A digital screen displaying analytical data with line graphs, histograms, and numerical values. The data is presented in a user-friendly interface with different shades of blue used to distinguish various elements.
SQL Optimization

Enhanced query performance for large datasets effectively.

Dashboard Creation

Developed interactive dashboards using Power BI and Tableau.

Client Feedback

Hear what our clients say about our work.

Datafreak transformed our data processes, making them efficient and reliable. Highly recommend for any data engineering needs!

John Doe
A visualization of a data storage system featuring a main server unit connected to a series of cylindrical storage units. The server has multiple horizontal rows, each with indicators. The background is black, providing a strong contrast to the metallic and green tones of the server and storage units.

New York

The expertise in ETL and dashboard creation is unmatched. Datafreak helped us visualize our data effectively, leading to better business decisions.

A workspace with technical drawings, a pen, a calculator, and a USB drive scattered on a desk. The setting suggests an environment focused on design or engineering, with blueprints and sketches partially visible. The lighting is warm and subdued.
Jane Smith

San Francisco

★★★★★
★★★★★